
When bakeries compare baking trays, the first number on the table is usually the unit price. It is easy to collect and easy to compare. It is also only part of the story. Aluminium foil trays, reusable metal pans, paper forms and fiber-based trays such as G-Flute each move cost to different places in the process. The right comparison is the total cost per baked unit.
The five lines of the calculation
We use five lines, the same ones measured in every line trial:
- Tray cost. The landed price per unit, including freight, storage and handling of incoming stock.
- Labour. Seconds of handling per unit for greasing, de-panning, washing, re-stacking or transferring the product to a retail pack.
- Rejects. Units lost to deformation, leakage, sticking or damage, valued at full product cost.
- Process stability. Stoppages and slowdowns caused by the tray, converted to lost output.
- Packaging downstream. Any secondary pack that the tray makes unnecessary, or requires.
Where the differences usually appear
Reusable pans carry no unit price, but they bring washing, greasing, de-panning and replacement costs, and the product still needs a retail pack.
Single-use foil and plastic trays remove washing and can go to retail, but material choice is increasingly shaped by recyclability requirements and customer expectations.
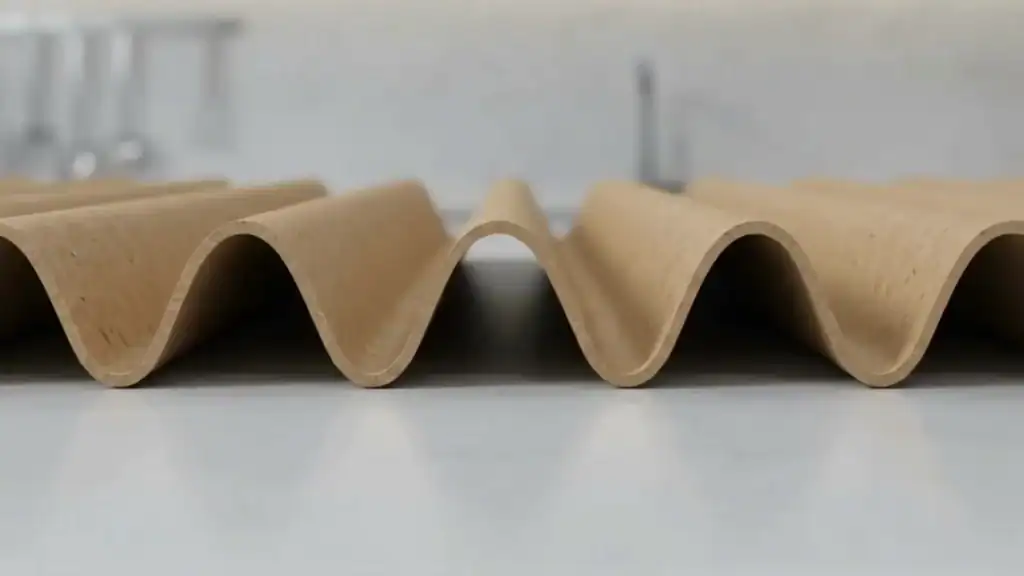
Fiber-based ovenable trays combine the baking form and the retail pack. The value comes from removed steps and lower rejects, measured against a unit price that must be justified on the line.
Building the figure
For each option, express every line per finished unit and add them up. Keep the assumptions visible: labour rate, line speed, product value and annual volume. Then test how the result changes if the assumptions move. A tray that wins only under perfect conditions is a risk; a tray that wins across a reasonable range is a decision.
A worked structure
| Line | Current tray | Trial tray |
|---|---|---|
| A · Tray cost per unit | measured | measured |
| B · Labour per unit | seconds × rate | seconds × rate |
| C · Rejects per unit | % × product cost | % × product cost |
| D · Stability per unit | lost output share | lost output share |
| Σ · Cost per baked unit | A+B+C+D | A+B+C+D |
The difference in the last line is the figure the decision is made on. Request a line trial and we will build it with you, using your own numbers.